文章标题
PHENOTYPE INFORMATION FOR 004456
文章内容
NONcNZO10/LtJ
NONcNZO10/LtJ (also known as RCS-10) males develop maturity-onset diabetes without the extreme weight gain characteristic of other models. When fed a moderately high fat diet (LabDiet 5K20; 11% fat, w/w), NONcNZO10/LtJ males develop polygenic diabetes that includes
-
Modest weight gain, unlike ob/ob or db/db mice (Figure 1)
-
Non-fasting hyperglycemia that develops with age, in contrast to db/db mice with juvenile onset (Figure 2)
-
Glucose intolerance by 16 weeks of age (Figure 3)
-
Increasing abundance of glycated hemoglobin (% HbA1c), a stable marker for blood glucose levels (Figure 4)
Males are maintained on the 11% fat diet to maximize the metabolic phenotypes. If males are fed a lower-fat diet (4% w/w), they have significantly lower blood glucose levels, and they are more glucose-tolerant. NONcNZO10/LtJ females do not develop diabetes on either diet (JAX® NOTES Issue 497, Spring 2005).
Blood glucose measurements were obtained using a OneTouch® Ultra hand-held glucometer. For the glucose tolerance tests, mice were fasted 14-16 hours, and glucose was administered by oral gavage at 2g/kg body weight. Blood glucose was measured in 30 min intervals.
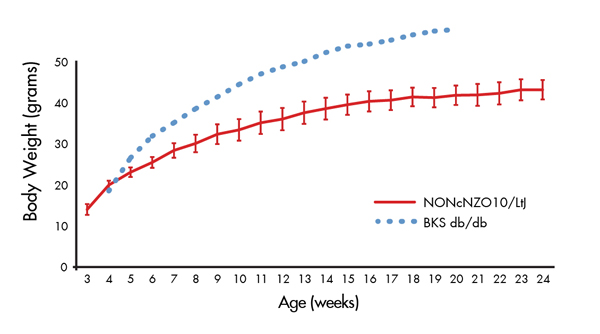
Figure 1. Modest weight gain of NONcNZO10/LtJ mice. Weekly body weights of NONcNZO10/LtJ males maintained on an 11% fat diet. Data represent mean values and standard deviations of 20 mice. As a reference, the mean body weights from BKS db/db mice (BKS.Cg-Dock7m +/+ Leprdb/J, Stock No. (000642)) are included from a separate study.
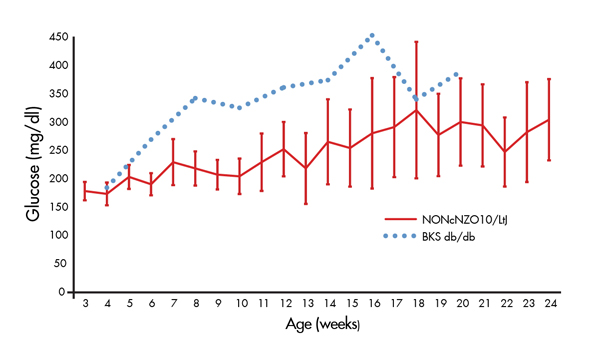
Figure 2. Non-fasting hyperglycemia increases with age. Weekly non-fasting blood glucose values from NONcNZO10/LtJ males maintained on an 11% fat diet. Data points represent mean values and standard deviations of 20 mice. As a reference, mean blood glucose values of BKS db/db mice (BKS.Cg-Dock7m +/+ Leprdb/J, Stock No. (000642)) are included from a separate study.
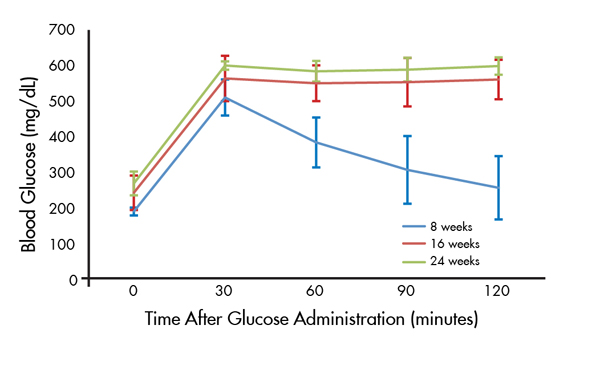
Figure 3. Glucose intolerance by 16 weeks of age. Oral glucose tolerance test of NONcNZO10/LtJ males on an 11% fat diet. Data points represent mean values and standard deviations of 10 mice.
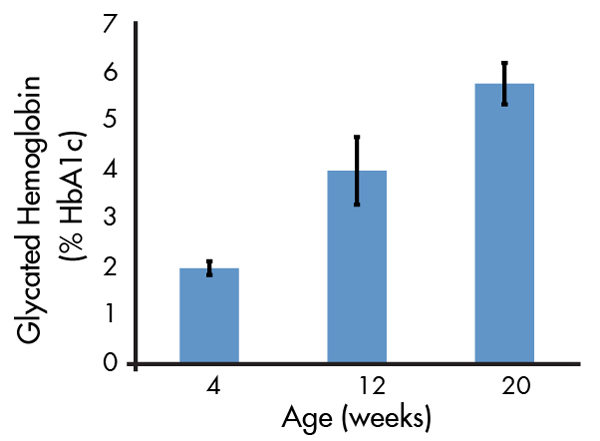
Figure 4. Glycated hemoglobin increases with age. The percentage of glycated hemoglobin (% HbA1c) at different ages, reported in International Federation of Clinical Chemistry (IFCC) units. Values represent means and standard deviations of 10 mice per age.
搜索分组