文章标题
PHENOTYPE INFORMATION FOR BKS-DB (000642)
文章内容
Male and female C57BLKS/J mice with the leptin receptor mutation (BKS-db; BKS.Cg-Dock7m +/+ Leprdb/J) develop type 2 diabetes with phenotypes that include:
-
Glucose intolerance by 8 weeks of age (Figure 3)
-
Elevated serum total & HDL cholesterol, glucose, and triglycerides (Table 3)
Complete results, including spleen flow cytometry data, are available from the Mouse Phenome Database.

Figure 1 Body weight growth curve. Weekly body weights of male (left) and female (right) mice. Cohorts included approximately 80 db/db homozygous, 30 db/+ heterozygous, and 30 wildtype (+/+) mice per sex. Mice were fed a diet containing 6% fat (LabDiet® 5K52 formulation). Values represent mean and one standard deviation.
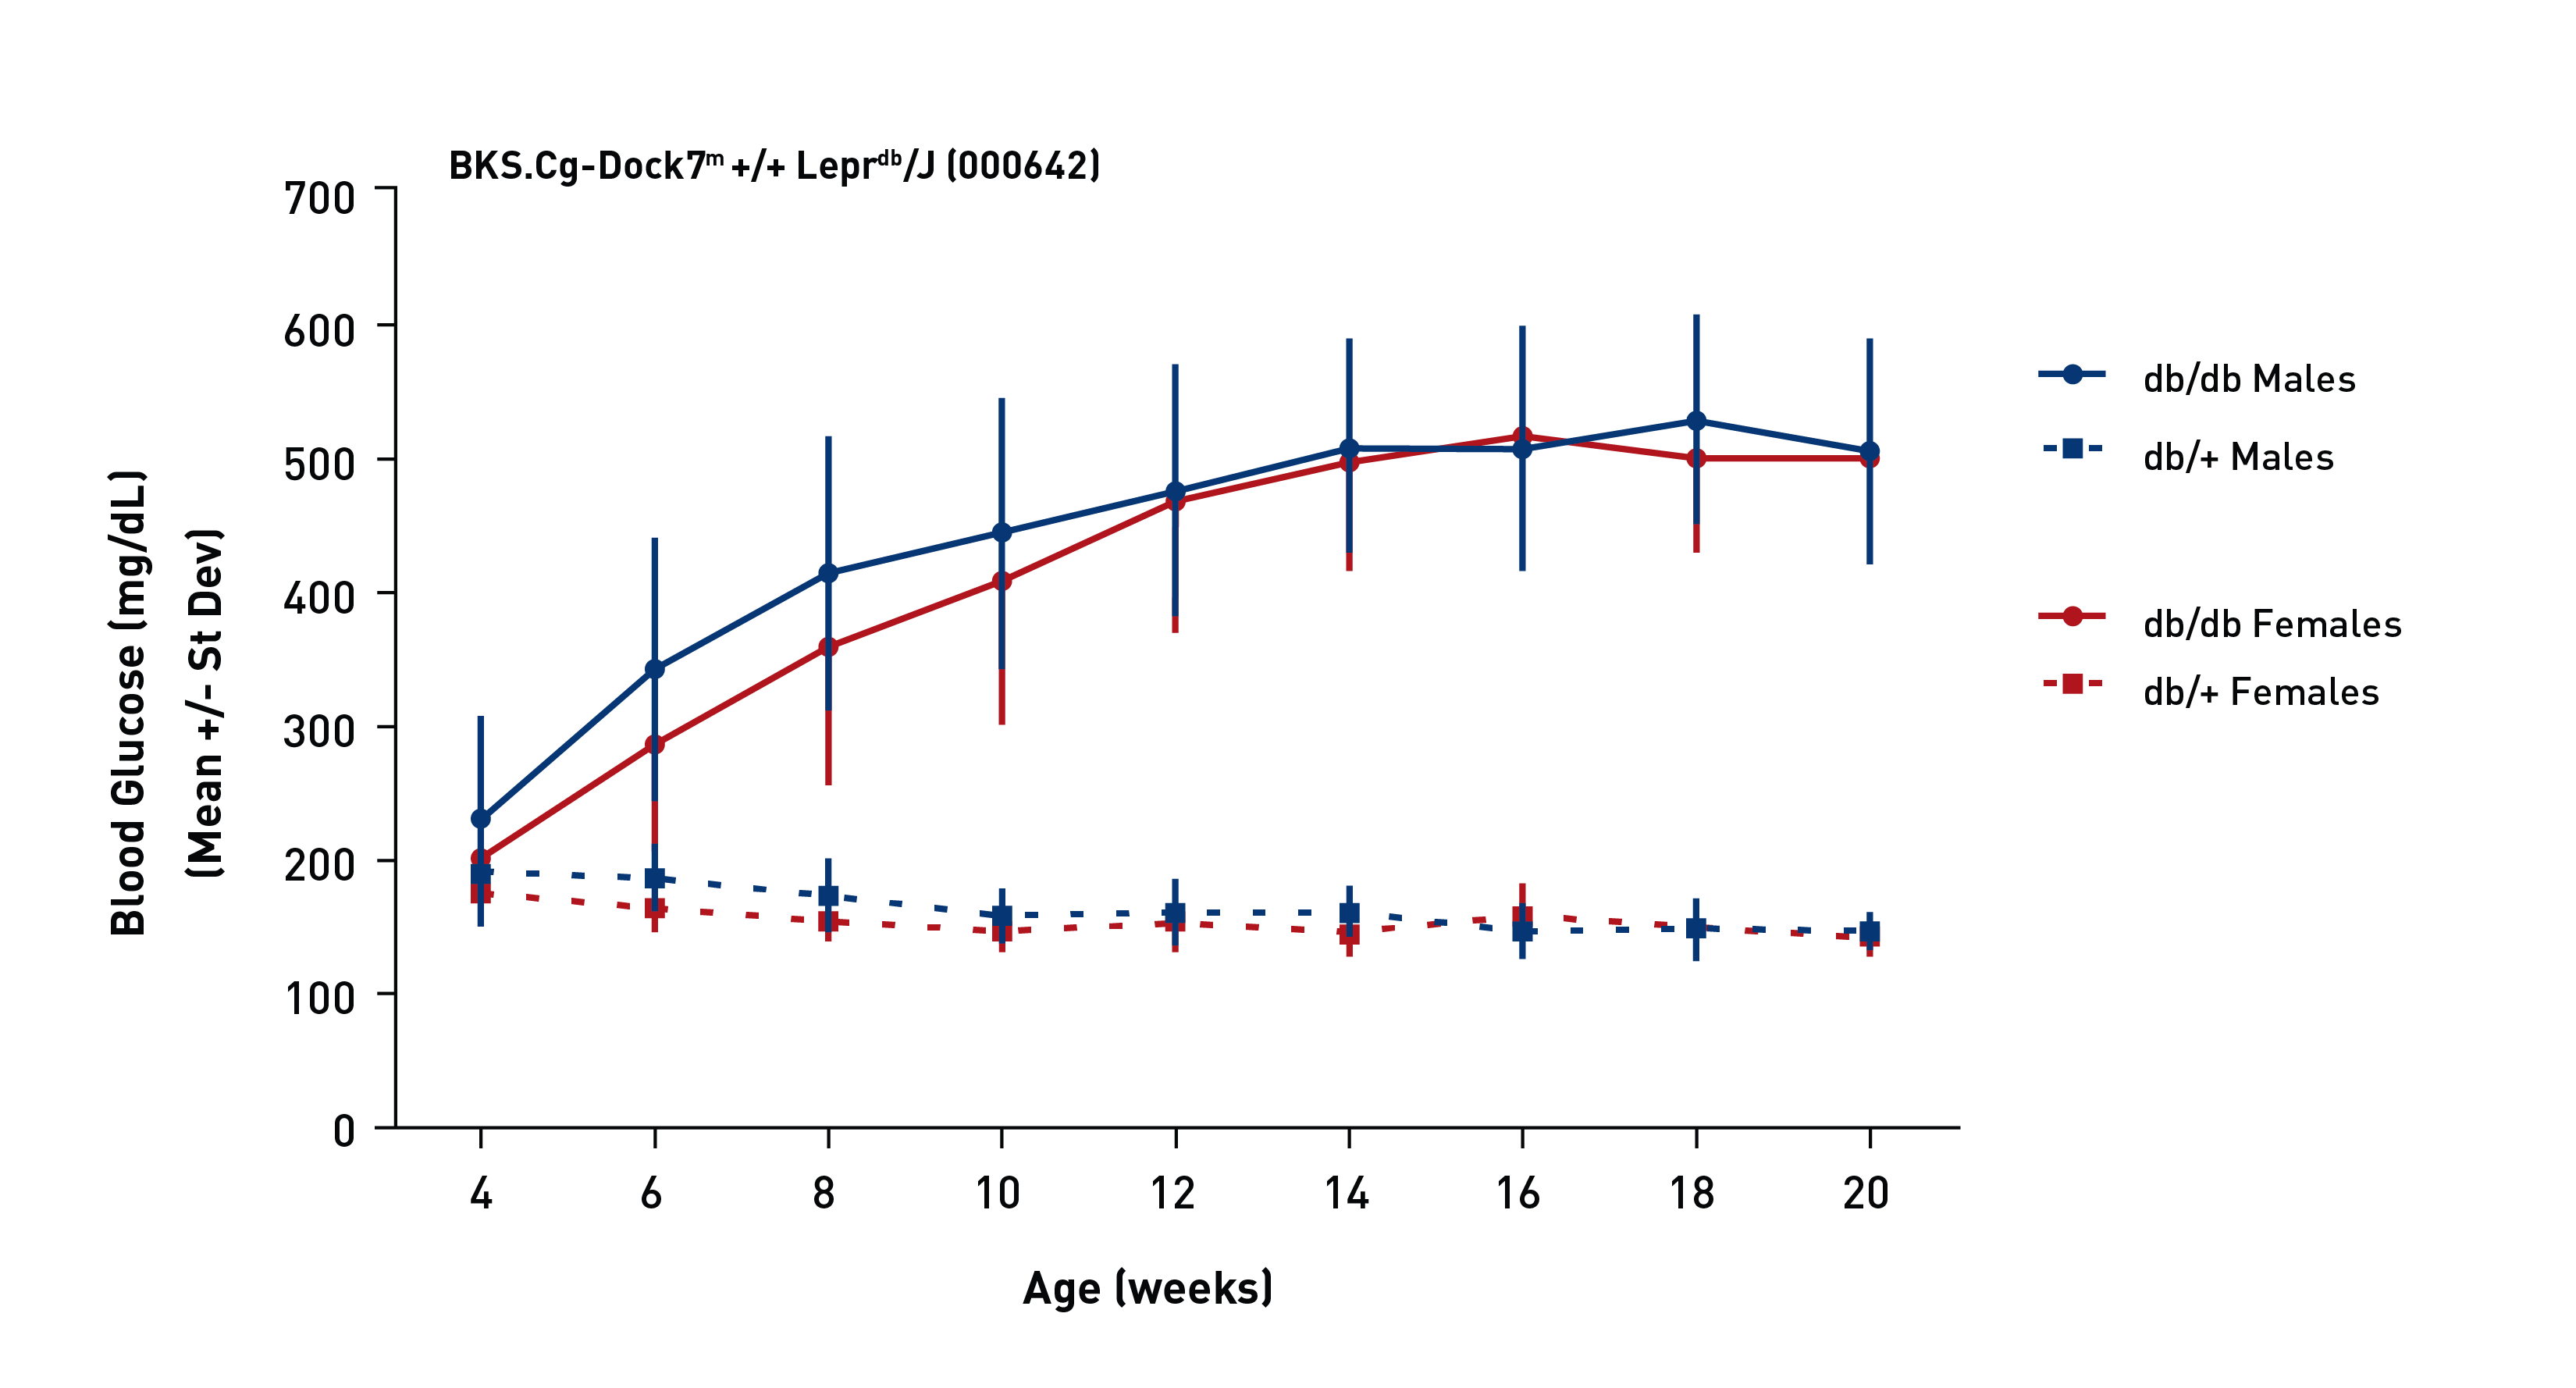
Figure 2 Nonfasted glucose. Blood glucose levels in male and female db/db and db/+ mice measured every other week. Submandibular blood glucose measurements were obtained using a OneTouch Ultra 2 or UltraMini hand-held glucometer that was validated with a control glucose solution on each day of use. Values represent mean and one standard deviation. Glucose levels of +/+ mice were similar to db/+; complete results are available in Mouse Phenome Database.

Figure 3 Glucose tolerance tests. Blood glucose levels during glucose tolerance tests (GTT) at 8 weeks in males (left) and females (right). Following a 16 hour fast, an initial submandibular blood glucose reading was taken and mice were administered glucose by IP injection at 2g/kg body weight. Blood glucose was measured in 30 minute intervals. Values represent mean and one standard deviation of 20 mice per diet and time point. Any result exceeding the maximum reading of the meter was recorded as 600 mg/dL. GTT performed on mice at 16 weeks gave similar results (not shown).
Table 1 Distribution of db/db blood glucose values. The blood glucose values of db/db males and females shown in Figure 2 were grouped into ranges. Rows indicate the percentage of mice in the indicated ranges, with the exception of the final row that states the number of mice tested at each age.
| Glucose Range (mg/dL) | 4 Weeks | 6 Weeks | 8 Weeks | 10 Weeks | 12 Weeks | 14 Weeks | 16 Weeks | 18 Weeks | 20 Weeks | |||||||||
|---|---|---|---|---|---|---|---|---|---|---|---|---|---|---|---|---|---|---|
|
Males |
Fema les |
Males |
Fema les |
Males |
Fema les |
Males |
Fema les |
Males |
Fema les |
Males |
Fema les |
Males |
Fema les |
Males |
Fema les |
Males |
Fema les |
|
| < 250 | 71% | 83% | 18% | 33% | 6% | 15% | 3% | 9% | 3% | 3% | 2% | 2% | 2% | 0% | 0% | 0% | 0% | 0% |
| 250 - 349 | 21% | 15% | 36% | 46% | 18% | 33% | 12% | 16% | 9% | 7% | 3% | 3% | 3% | 2% | 6% | 5% | 4% | 5% |
| 350 - 450 | 5% | 1% | 34% | 15% | 41% | 29% | 35% | 36% | 27% | 31% | 15% | 17% | 20% | 19% | 8% | 19% | 25% | 21% |
| > 450 | 3% | 0% | 13% | 5% | 34% | 22% | 50% | 39% | 61% | 58% | 80% | 79% | 76% | 80% | 87% | 77% | 71% | 74% |
| # Mice | 80 | 76 | 80 | 76 | 79 | 76 | 66 | 65 | 66 | 65 | 66 | 65 | 66 | 63 | 53 | 43 | 52 | 43 |
Table 2 Body Composition. Mice were weighed and then analyzed using a Lunar PIXImus DEXA scanner. Calculations of body composition exclude the head. Values represent mean and one standard deviation of 10 non-fasted db/db and 4-5 db/+ & +/+ mice per sex and age. Results were analyzed by age and sex using two-way ANOVA with Sidak’s multiple comparisons test to identify values that differed significantly between genotypes, using GraphPad Prism version 7.04 for Windows (GraphPad Software).
| Age & Sex | Genotype | Body Weight (g) | Bone Mineral Density (g/cm2) | Bone Mineral Content (g) | Bone Area (cm2) | Lean Tissue (g) | Fat Tissue (g) | Percent Fat Tissue |
|---|---|---|---|---|---|---|---|---|
| 8 Week Males | db/db | 40.1 ± 1.6a | 0.040 ± 0.001 | 0.33 ± 0.02 | 8.22 ± 0.49 | 17.0 ± 1.1 | 21.9 ± 1.3 | 56.2 ± 2.4 |
| db/+ | 28.4 ± 1.6a | 0.048 ± 0.003 | 0.34 ± 0.05 | 7.11 ± 0.57 | 19.3 ± 1.0b | 7.9 ± 0.9a | 29.0 ± 2.2a | |
| +/+ | 23.4 ± 0.9a,c | 0.048 ± 0.002 | 0.33 ± 0.02 | 6.90 ± 0.43 | 17.4 ± 0.5f | 4.9 ± 0.4a,d | 22.1 ± 1.2a,c | |
| 8 Week Females | db/db | 40.1 ± 2.7 | 0.038 ± 0.001 | 0.28 ± 0.03 | 7.36 ± 0.75 | 16.9 ± 1.1 | 22.0 ± 1.8 | 56.5 ± 1.9 |
| db/+ | 22.2 ± 1.4a | 0.048 ± 0.004 | 0.32 ± 0.05 | 6.66 ± 0.92 | 15.4 ± 0.6 | 5.9 ± 1.0a | 27.6 ± 3.1a | |
| +/+ | 18.1 ± 1.5a,e | 0.047 ± 0.002 | 0.31 ± 0.02 | 6.61 ± 0.54 | 13.1 ± 0.9a,f | 4.1 ± 0.6a,c | 23.5 ± 2.0a,c | |
| 16 Week Males | db/db | 53.5 ± 4.0 | 0.044 ± 0.001 | 0.33 ± 0.02 | 7.52 ± 0.53 | 18.5 ± 1.3 | 31.5 ± 4.3 | 63.7 ± 2.6 |
| db/+ | 32.9 ± 3.1a | 0.055 ± 0.002 | 0.41 ± 0.03 | 7.42 ± 0.29 | 21.6 ± 2.0 | 9.3 ± 1.0a | 30.0 ± 0.9a | |
| +/+ | 28.8 ± 1.7a | 0.055 ± 0.001 | 0.44 ± 0.03 | 8.15 ± 0.51 | 19.8 ± 0.5 | 7.2 ± 1.1a | 26.6 ± 2.7a | |
| 16 Week Females | db/db | 55.3 ± 4.5 | 0.044 ± 0.002 | 0.33 ± 0.11 | 7.46 ± 2.14 | 18.5 ± 2.1 | 34.6 ± 3.3 | 65.1 ± 3.0 |
| db/+ | 27.7 ± 2.0a | 0.053 ± 0.001 | 0.42 ± 0.02 | 7.93 ± 0.44 | 17.0 ± 0.3 | 9.0 ± 1.6a | 34.5 ± 3.6a | |
| +/+ | 23.4 ± 4.5a | 0.050 ± 0.003 | 0.36 ± 0.02 | 7.33 ± 0.39 | 15.2 ± 0.6a | 4.2 ± 0.6a | 21.4 ± 2.5a,c | |
|
a P ≤ 0.0001, b P ≤ 0.001, (pairwise comparisons with db/db); c P ≤ 0.0001, d P ≤ 0.001, e P ≤ 0.05 f P ≤ 0.05 (pairwise comparisons with db/+ |
||||||||
Table 3 Clinical Chemistry. All values were measured from serum collected from submandibular blood except HbA1c, which was measured from submandibular whole blood. Values represent mean and one standard deviation of 10-20 non-fasted db/db mice and 5-10 db/+ & +/+ mice per age and sex. Results were obtained using a Beckman Coulter AU680 chemistry analyzer. Results were analyzed by age and by sex using two-way ANOVA with Sidak’s multiple comparisons test to identify values that differed significantly between genotypes, using GraphPad Prism version 7.04 for Windows (GraphPad Software).
| Age & Sex | Genotype | Total Cholesterol (mg/dL) | HDL Cholesterol (mg/dL) | LDL Cholesterol (mg/dL) | Triglycerides (mg/dL) | Free Fatty Acids (mEq/L) | Glucose (mg/DL) | HbA1c (NGSP %) |
|---|---|---|---|---|---|---|---|---|
| 8 Week Males | db/db | 186 ± 22 | 119 ± 7 | 9.5 ± 2.0 | 179 ± 37 | 1.5 ± 0.3 | 560 ± 70 | 7.5 ± 1.0 |
| db/+ | 104 ± 7a | 75 ± 7a | 5.0 ± 1.4 a | 112 ± 20a | 0.9 ± 0.3 | 176 ± 41a | 4.9 ± 0.1 | |
| +/+ | 94 ± 3a | 70 ± 3a | 3.4 ± 0.5a | 105 ± 18a | 1.1 ± 0.2 | 192 ± 21a | 4.8 ± 0.1 | |
| 8 Week Females | db/db | 171 ± 21 | 116 ± 12 | 8.1 ± 1.2 | 180 ± 42 | 1.5 ± 0.2 | 551 ± 85 | 7.1 ± 0.8 |
| db/+ | 81 ± 14a | 59 ± 8a | 5.8 ± 1.8 | 113 ± 15a | 1.1 ± 0.1 | 167 ± 16a | 4.6 ± 0.1 | |
| +/+ | 75 ± 14a | 54 ± 8a | 5.7 ± 0.8 | 99 ± 16a | 1.1 ± 0.2 | 159 ± 19a | 4.6 ± 0.1a | |
| 16 Week Males | db/db | 178 ± 25 | 130 ± 10 | 5.1 ± 1.1 | 155 ± 45 | 1.8 ± 0.2 | 754 ± 77 | 13.1 ± 1.3 |
| db/+ | 100 ± 9a | 93 ± 16c | 4.6 ± 0.9 | 131 ± 32 | 1.2 ± 0.4 | 201 ± 39a | 5.0 ± 0.4 | |
| +/+ | 95 ± 11a | 75 ± 10a | 3.2 ± 0.4 | 101 ± 12a | 1.1 ± 0.3 | 201 ± 31a | 5.1 ± 0.4 | |
| 16 Week Females | db/db | 196 ± 32 | 138 ± 16 | 5.3 ± 1.2 | 216 ± 79 | 2.0 ± 0.4 | 752 ± 101 | 12.0 ± 1.9 |
| db/+ | 93 ± 14a | 69 ± 6b | 6.3 ± 1.6 | 129 ± 26a | 1.0 ± 0.1 | 172 ± 23a | 5.0 ± 0.3 | |
| +/+ | 79 ± 11a | 57 ± 7a | 5.0 ± 0.9 | 107 ± 30a | 0.8 ± 0.1 | 164 ± 11a | 5.0 ± 0.3 | |
|
a P ≤ 0.0001, b P ≤ 0.001, c P ≤ 0.01 (pairwise comparisons with db/db) |
||||||||
搜索分组