Type 2 diabetes phenotypes in male and female C57BL/6J leptin mutant mice (B6-ob; B6.Cg-Lepob/J) include:
- Severe obesity (Figure 1 and Table 2)
- Transient hyperglycemia: average blood glucose peaks at 8 weeks and returns to normal levels by 14 weeks (Figure 2 and Table 1) due to pancreatic islet cell hypertrophy in the C57BL/6 background.
- Elevated serum total cholesterol, HDL cholesterol, triglycerides and glucose at 8 weeks of age; elevated serum total cholesterol, HDL cholesterol and glucose (females) at 16 weeks of age (Table 3)
- Glucose intolerance at 8 & 16 weeks (Figure 3)
Homozygous ob/ob mice are fed LabDiet 5K20 (10% fat w/w) and heterozygous ob/+ mice are fed LabDiet 5K52 formulation (6% fat w/w). Complete results, including spleen flow cytometry data, are available from the Mouse Phenome Database.
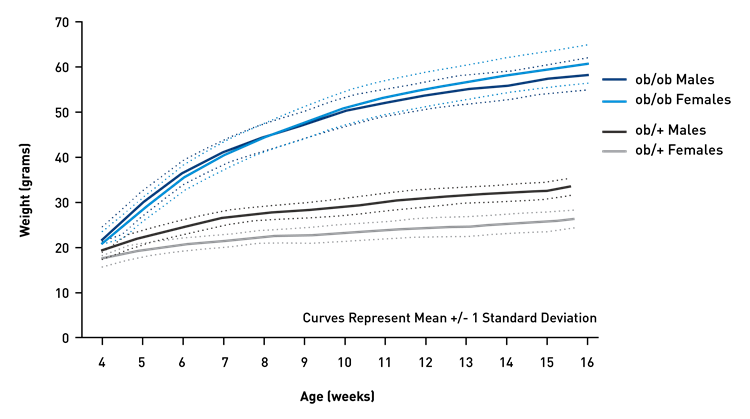
Figure 1 Body weight growth curve. Weekly weights of male and female mice between the ages of 4 and 16 weeks. Values represent the mean and one standard deviation of at least 40 mice per age.
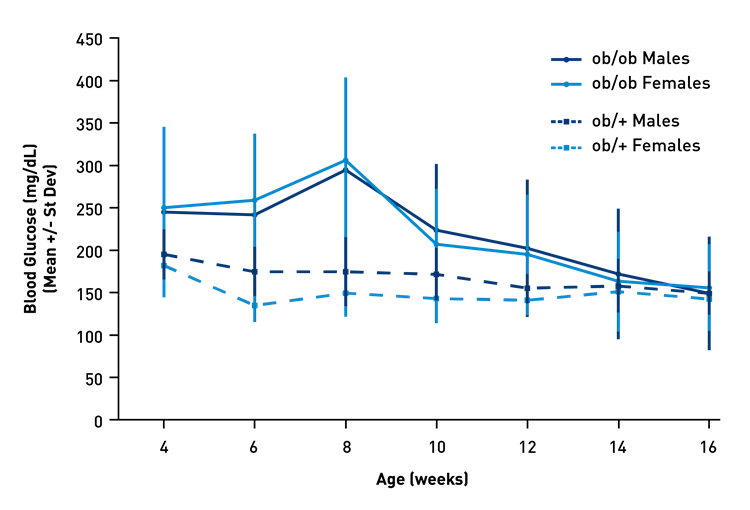
Figure 2 Non-fasted glucose. Blood glucose levels of male and female mice between the ages of 6 and 16 weeks. Submandibular blood glucose measurements were obtained using a OneTouch Ultra 2 or UltraMini hand-held glucometer that was validated with a control glucose solution on each day of use. Values represent the mean and one standard deviation of at least 40 non-fasted mice.
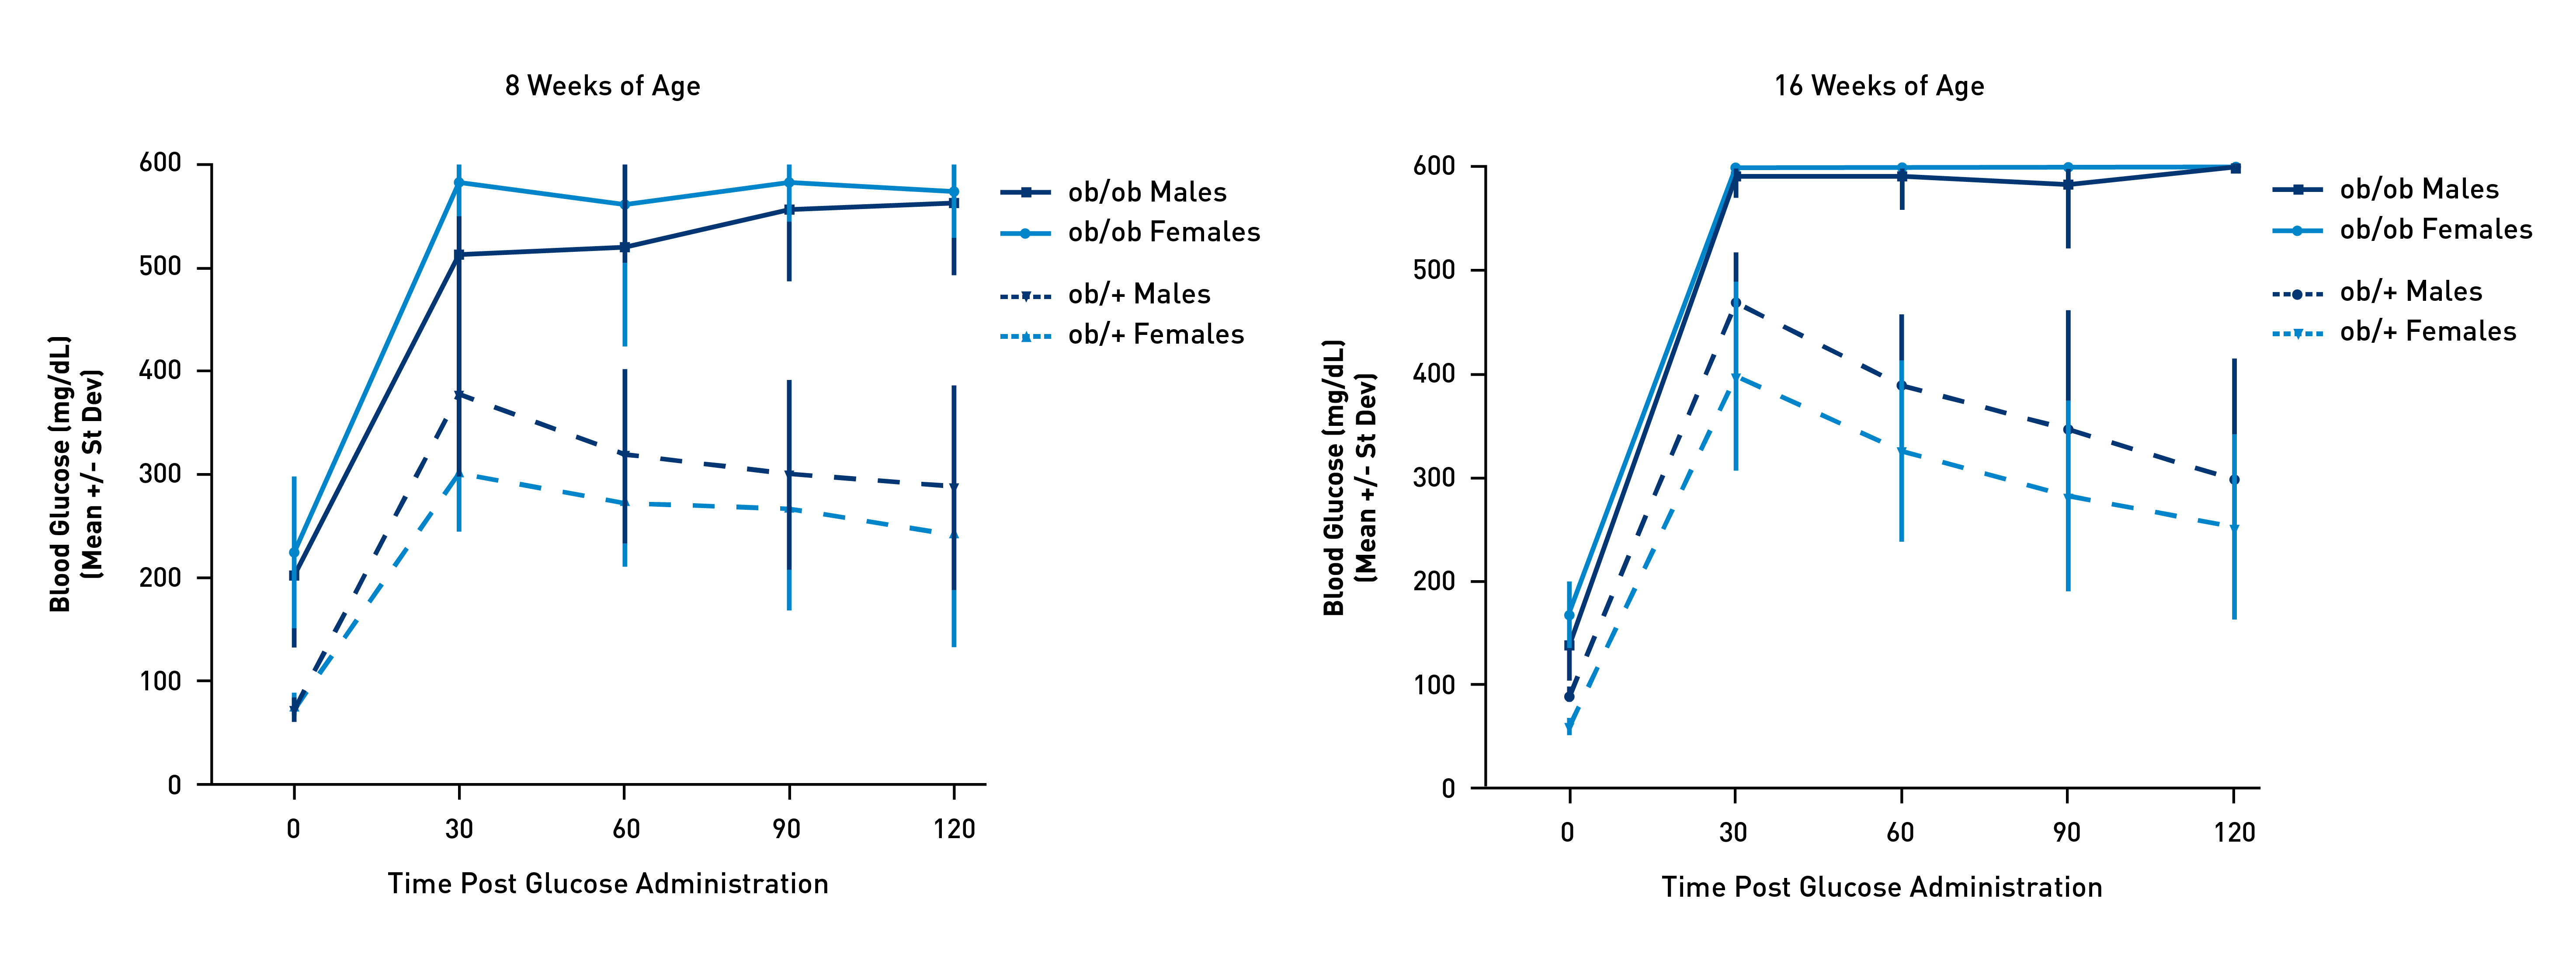
Figure 3 Glucose tolerance tests. Blood glucose levels during glucose tolerance tests (GTT) at 8 and 16 weeks of age. Following a 16 hour fast, an initial submandibular blood glucose reading was taken and mice were administered glucose by IP injection at 2 g/kg body weight. Blood glucose was measured in 30 minute intervals. Any result exceeding the maximum reading of the meter was recorded as 600 mg/dL. Each data point represents the mean and one standard deviation of 10-20 mice.
Table 1 Distribution of homozygous (ob/ob) blood glucose values. The blood glucose values shown in Figure 2 were grouped into ranges to show the reversion to non-diabetic values as ob/ob mice age. Rows indicate the percentage of mice in the indicated ranges, with the exception of the final row that states the number of mice analyzed.
| Glucose Range (mg/dL) | 4 Weeks | 6 Weeks | 8 Weeks | 10 Weeks | 12 Weeks | 14 Weeks | 16 Weeks | |||||||
|---|---|---|---|---|---|---|---|---|---|---|---|---|---|---|
| Males | Females | Males | Females | Males | Females | Males | Females | Males | Females | Males | Females | Males | Females | |
| < 250 | 58% | 62% | 56% | 58% | 33% | 33% | 77% | 88% | 83% | 85% | 94% | 98% | 98% | 98% |
| 250 - 349 | 29% | 22% | 36% | 25% | 38% | 33% | 17% | 9% | 13% | 12% | 3% | 0% | 0% | 0% |
| 350 - 450 | 11% | 13% | 9% | 15% | 23% | 25% | 4% | 2% | 3% | 2% | 0% | 0% | 0% | 2% |
| > 450 | 2% | 4% | 0% | 1% | 6% | 9% | 1% | 2% | 1% | 2% | 3% | 2% | 2% | 0% |
| # Mice | 91 | 79 | 90 | 79 | 69 | 67 | 69 | 65 | 69 | 65 | 68 | 65 | 48 | 46 |
Table 2 Body Composition. Mice were weighed and then analyzed using a Lunar PIXImus DEXA scanner. Calculations of body composition exclude the head. Values represent mean and one standard deviation of 10 non-fasted mice per diet and age. Results were analyzed separately by age and sex using two-way ANOVA with Sidak’s multiple comparisons test to identify values that differed significantly between genotypes, using GraphPad Prism version 6.07 for Windows (GraphPad Software).
| Age & Sex | Genotype | Body Weight (g) | Bone Mineral Density (g/cm2) | Bone Mineral Content (g) | Bone Area (cm2) | Lean Tissue (g) | Fat Tissue (g) | Percent Fat Tissue |
|---|---|---|---|---|---|---|---|---|
| 8 Week Males | ob/ob | 43.2 ± 1.6a | 0.046 ± 0.001 | 0.45 ± 0.03 | 9.7 ± 0.6 | 17.7 ± 0.9b | 24.4 ± 2.3a | 57.9 ± 3.2a |
| ob/+ | 27.0 ± 1.2a | 0.050 ± 0.002 | 0.41 ± 0.03 | 8.4 ± 0.7 | 20.4 ± 0.8b | 5.9 ± 0.8a | 22.4 ± 2.3a | |
| 8 Week Females | ob/ob | 42.3 ± 2.1a | 0.043 ± 0.001 | 0.37 ± 0.03 | 8.6 ± 0.7 | 16.3 ± 1.1b | 24.8 ± 2.6a | 60.1 ± 3.3a |
| ob/+ | 21.1 ± 1.1a | 0.047 ± 0.001 | 0.35 ± 0.02 | 7.3 ± 0.4 | 15.2 ± 0.9 | 5.1 ± 0.9a | 24.8 ± 3.5a | |
| 16 Week Males | ob/ob | 57.4 ± 2.2a | 0.053 ± 0.003 | 0.58 ± 0.07 | 10.8 ± 1.1 | 21.5 ± 1.5 | 34.1 ± 2.8a | 61.3 ± 2.9a |
| ob/+ | 31.8 ± 1.8a | 0.056 ± 0.003 | 0.51 ± 0.04 | 9.0 ± 0.6 | 23.6 ± 1.5 | 7.4 ± 1.5a | 23.8 ± 4.3a | |
| 16 Week Females | ob/ob | 60.7 ± 3.8a | 0.048 ± 0.002 | 0.45 ± 0.06 | 9.5 ± 1.3 | 20.3 ± 1.1b | 38.0 ± 2.8a | 65.1 ± 2.2a |
| ob/+ | 26.2 ± 2.2a | 0.055 ± 0.002 | 0.47 ± 0.02 | 8.5 ± 0.3 | 18.0 ± 1.1 | 7.1 ± 1.7a | 28.0 ± 3.8a | |
|
a P ≤ 0.0001 b P ≤ 0.001 |
||||||||
Table 3 Clinical chemistry. All values were measured from serum collected from submandibular blood except HbA1c, which was measured from submandibular whole blood. Values represent mean and one standard deviation of 10-20 non-fasted mice per age, sex, and genotype. Results were obtained using a Beckman Coulter AU680 chemistry analyzer. Results were analyzed separately by age and sex using two-way ANOVA with Sidak’s multiple comparisons test to identify values that differed significantly by genotype, using GraphPad Prism version 6.07 for Windows (GraphPad Software).
| Age & Sex | Genotype | Total Cholesterol (mg/dL) | HDL Cholesterol (mg/dL) | LDL Cholesterol (mg/dL) | Triglycerides (mg/dL) | Free Fatty Acids (mEq/L) | Glucose (mg/DL) | HbA1c (NGSP %) |
|---|---|---|---|---|---|---|---|---|
| 8 Week Males | ob/ob | 238 ± 22a | 152 ± 13a | 8.0 ± 1.3 | 218 ± 92a | 1.30 ± 0.29 | 362 ± 72a | 7.9 ± 1.6 |
| ob/+ | 131 ± 20a | 95 ± 12a | 4.4 ± 1.8 | 153 ± 44a | 1.45 ± 0.35 | 199 ± 29a | 5.6 ± 0.3 | |
| 8 Week Females | ob/ob | 267 ± 58a | 160 ± 25a | 10.1 ± 2.7 | 222 ± 47a | 1.62 ± 0.32 | 261 ± 47a | 6.7 ± 0.8 |
| ob/+ | 103 ± 14a | 74 ± 12a | 6.1 ± 1.1 | 151 ± 27a | 1.61 ± 0.45 | 168 ± 18a | 5.2 ± 0.3 | |
| 16 Week Males | ob/ob | 274 ± 34a | 170 ± 14a | 16.3 ± 4.4 | 131 ± 27 | 0.88 ± 0.10 | 212 ± 46 | 8.1 ± 0.7 |
| ob/+ | 127 ± 14a | 96 ± 9a | 2.5 ± 0.5 | 154 ± 30 | 1.02 ± 0.29 | 191 ± 24 | 6.0 ± 0.4 | |
| 16 Week Females | ob/ob | 198 ± 59a | 136 ± 34a | 7.2 ± 4.2 | 114 ± 42 | 0.83 ± 0.24 | 196 ± 51b | 6.4 ± 0.5 |
| ob/+ | 95 ± 10a | 72 ± 7a | 4.8 ± 0.6 | 136 ± 29 | 1.23 ± 0.34 | 166 ± 18b | 5.4 ± 0.4 | |
|
a P ≤ 0.0001 b P ≤ 0.01 |
||||||||